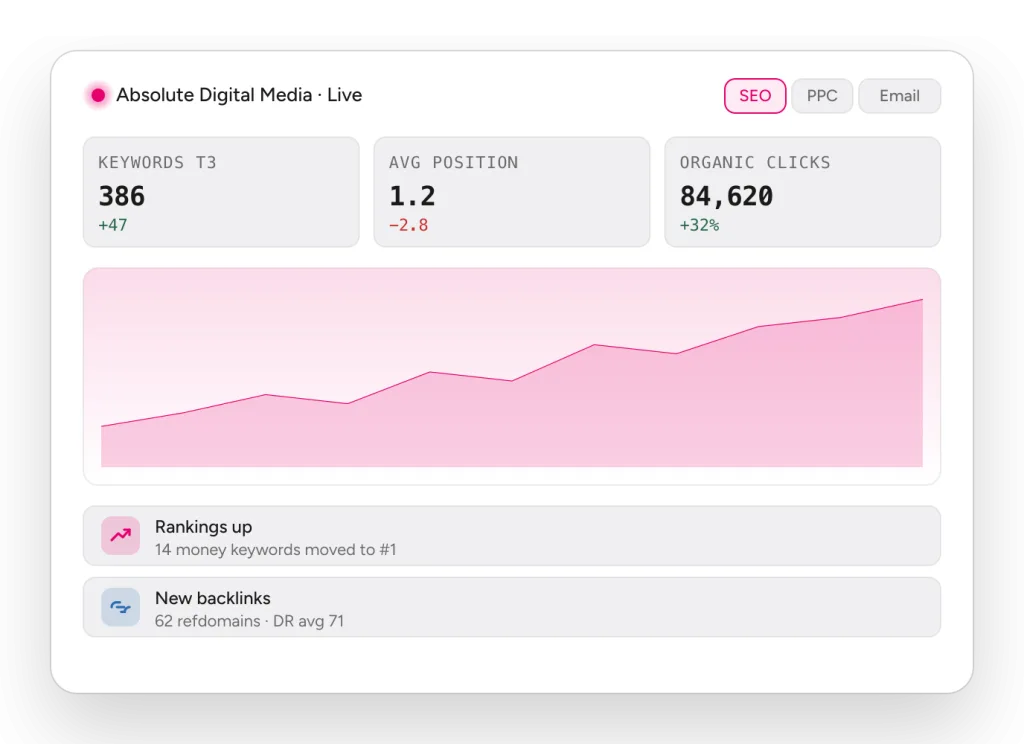

Most marketing reporting problems are not measurement problems. They are assembly problems. The data already exists. It is just scattered across five or six platforms that each describe a different slice of the same month, in different units, over different date ranges, and somebody has to spend a day stitching it into something a board will read. We got tired of that day. So we built something that removes it, and we give it to our clients as part of working with us.
This is what we built, and the thinking behind it.
The real cost of five dashboards
Search Console knows what you rank for. GA4 knows what visitors did once they arrived. Google Ads knows what you paid to get some of them. Your email platform knows who opened. Your link tooling knows who cites you. Not one of those systems knows what any of the others knows.
That fragmentation is more expensive than the time it eats:
- The numbers disagree. Two platforms counting “conversions” on different attribution windows will never quite match, and reconciling them every month is nobody’s idea of useful work.
- Reports arrive as snapshots. A deck built on the fifth of the month is already out of date by the tenth, and it cannot answer the question you thought of on the fifteenth.
- Comparison windows drift. One tool compares to last month, another to the same month last year, a third to a rolling thirty days. Three “up 12%” figures can describe three different realities.
- Context gets stripped out. This is the expensive one. A dashboard can tell you a number moved. It cannot tell you whether that was your campaign working, a competitor making a mistake, a seasonal pattern, or a core update.
That last point is the one that made us build rather than buy.
The blind spot nobody had to plan for in 2020
Something else changed while the reporting stack stayed the same. A growing share of buyers now put their question to an assistant instead of a search engine, and the assistant answers in prose. It synthesises, it cites a small handful of sources, and it never shows the user the other nine results.
If your reporting counts only positions in Google, that entire surface is invisible in it. You can be losing ground in the place where people form their first opinion of you and see nothing at all in your monthly report, because the report was designed for a version of search that is quietly being replaced.
We think about this as generative engine optimisation, and it is why the phrase we keep coming back to internally is every engine, every answer, every time. Ranking in Google is now one answer surface among several. So measurement has to cover the others.
That is why AI visibility is not a bolt-on module in what we built. It sits inside the SEO report, on the same period picker, next to the organic numbers: share of voice against your competitors across AI search engines, how often you are mentioned, and critically, which of your pages get cited when you are.
What ADMI is
ADMI, the Absolute Digital Media Intelligence Hub, is the client platform we built to solve the above. It brings every channel we run for a client behind one login, pulling live from the platforms that already hold the data rather than asking anyone to re-enter it.
There is one report per service, and they deliberately share an anatomy, so learning to read one teaches you all of them. The same tab strip, the same period picker, the same change indicators:
- SEO. Search Console and GA4 organic performance together, with conversion or ecommerce funnels, branded against generic search, top landing pages, audience splits and the AI visibility reporting described above. Every analytics figure is filtered to organic search only, so paid and direct traffic cannot inflate the SEO story.
- PPC. Spend, clicks, conversions, cost per conversion and return on ad spend across Google, Microsoft and Meta Ads, down to campaign, search term, shopping and demographic level.
- Link building. Placements secured against the monthly target we agreed, quality distribution by domain rating, and the full placement sheet with anchor text and the page each link points at.
- Digital PR. Coverage by outlet and by named campaign, with follow links counted separately from mentions, because only one of those passes authority.
- Email marketing. Delivery, opens, clicks, bounces and unsubscribes per campaign, with a toggle that strips Apple Mail’s machine opens so the open rate reflects actual humans.
- Reddit seeding. Threads created, comments seeded, subreddits active and combined community reach.
Alongside every report sit two tabs that are less glamorous and get read more than anything else: Work Delivered, which is what actually landed this month, and Planned Work, which is what is queued next. Categories with nothing in them are hidden rather than padded with zeroes.
Why we did not just buy a dashboard tool
Plenty of good reporting software exists. We looked. The gap was never the charting.
The gap is that a dashboard is an honest but mute witness. It will show you that organic clicks fell 8% and it will be completely correct, and it will offer you nothing about what to do next. The value in an agency relationship is the interpretation, and interpretation cannot be automated by a tool that does not know what work was commissioned, what the competitive set did, or what we chose not to do and why.
So every report in ADMI opens with a written executive overview from the account manager who runs the campaigns. What moved, why it moved, and what we are doing about it next month. Each month is prepared by the account team, goes through internal sign-off, and is only then published to the client’s hub. The live data updates continuously. The human context arrives monthly, which is the honest cadence for judgement as opposed to numbers.
That is the actual difference between this and a generic dashboard, and it is also why ADMI is not something you can buy on its own. It is the reporting layer of an agency engagement. Without the team attached, it would be a nicer looking version of the problem we set out to fix.
The thing that surprised us most
The cited-pages reporting has been the biggest source of genuine surprise, for us and for clients.
When you can see which of your URLs an AI assistant actually quotes, it is very rarely the page you would have nominated. It is often not the polished service page. It is an old comparison post, a technical explainer, a page nobody had thought about in two years. That tells you something specific and actionable about what the models have decided you are credible on, and it is usually a different answer from the one your own site structure implies.
You cannot act on that if you are not measuring it, and until recently almost nobody was.
How clients get access
ADMI is invite only. There is no public sign up and it is not sold separately. Your account manager creates the account, sets the permissions, connects the data sources, and sends a private invite link. Setup is something we do rather than something anyone has to project manage, and onboarding takes minutes.
If you already work with us and have not been set up yet, ask your account manager. If you do not, the fastest route is to see it against your own numbers.
Read more about ADMI, or book a free audit and we will show you what we would report on for your site, where the gaps are in what you can currently see, and what your first month in the hub would look like.